Dashboard
The Dashboard is displayed after logging in to the system. On the Dashboard, statistics on the use of resources, such as CPU, memory, storage, storage IOPS, bandwidth and health of the cloud, are presented.
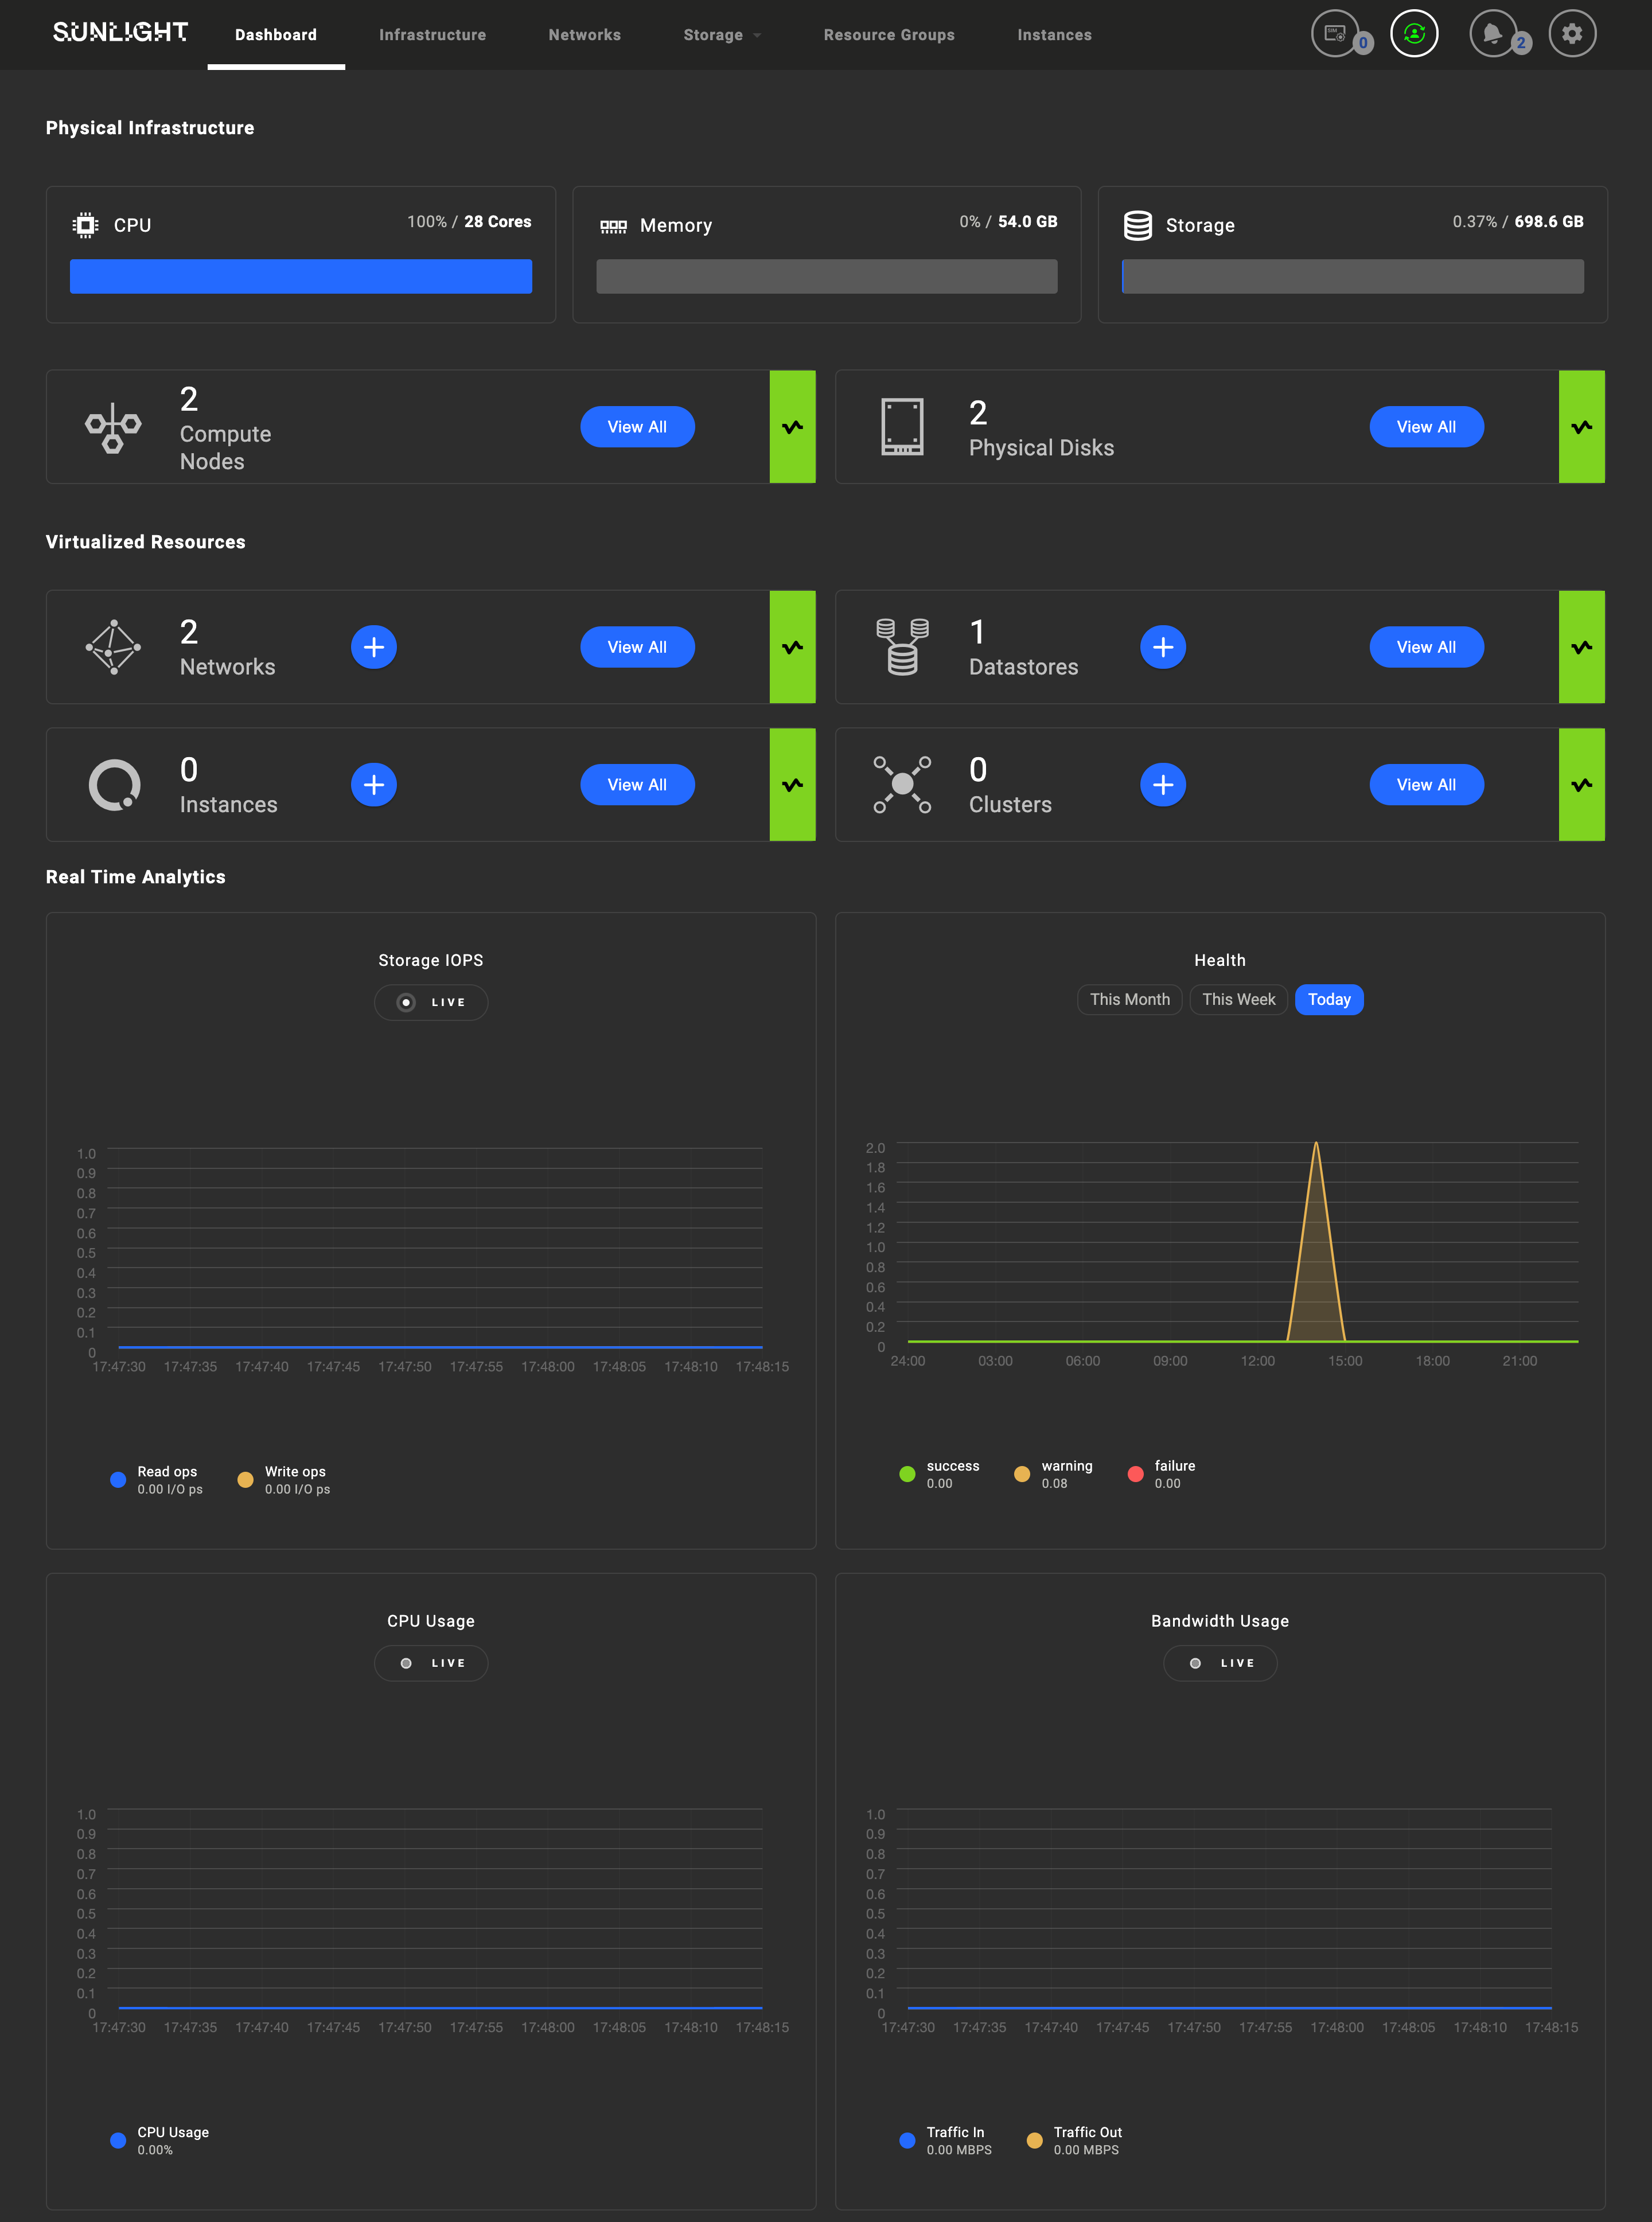
Resource statistics are visualized in the form of bars and charts that provide the following information.
| Resource | Used | Total |
|---|---|---|
| CPU Usage | The percentage of virtual cores used by the system. | The total amount of CPU cores available in the system. |
| Memory | The percentage of memory used by the system. | The total amount of memory (GB) available in the system. |
| Storage | The percentage of storage space used by the system. | The total amount of storage space (GB) available in the system. |
| Resource | Chart |
|---|---|
| Storage IOPS | The Storage IOPS chart displays peaks of reads and writes I/O per second, in real time. |
| Health | The Health chart displays the total number of actions, including statuses of success, warnings or failures for a selected period of time. The available time periods that can be selected are: 'This Month', 'This Week', or 'Today'. |
| CPU Usage | The CPU Usage chart displays the peaks of CPU usage (%) in real time. |
| Bandwidth Usage | The Bandwidth Usage chart displays the peaks of Traffic In/Out usage in MegaBits Per Second (MBPS) in real time. |
The first two resource widgets are reporting the health status of the physical resources of the cluster, including the actual nodes as well as the physical disks:
| Resource | Description | Action |
|---|---|---|
| Compute Nodes | The number of physical nodes, including their health status | View all |
| Physical Disks | The number of physical disks of the system, including their health status | View all |
The next four widgets report on the health status of the cluster, and provide the following immediate actions:
| Resource | Description | Action |
|---|---|---|
| Networks | The number of available networks, including their status | Add new network |
| Datastores | The number of available datastores, including their status | Add new datastore |
| Instances | The number of available instances, including their status | Add new instance |
| Clusters | The number of available clusters, including their status | Add new cluster |
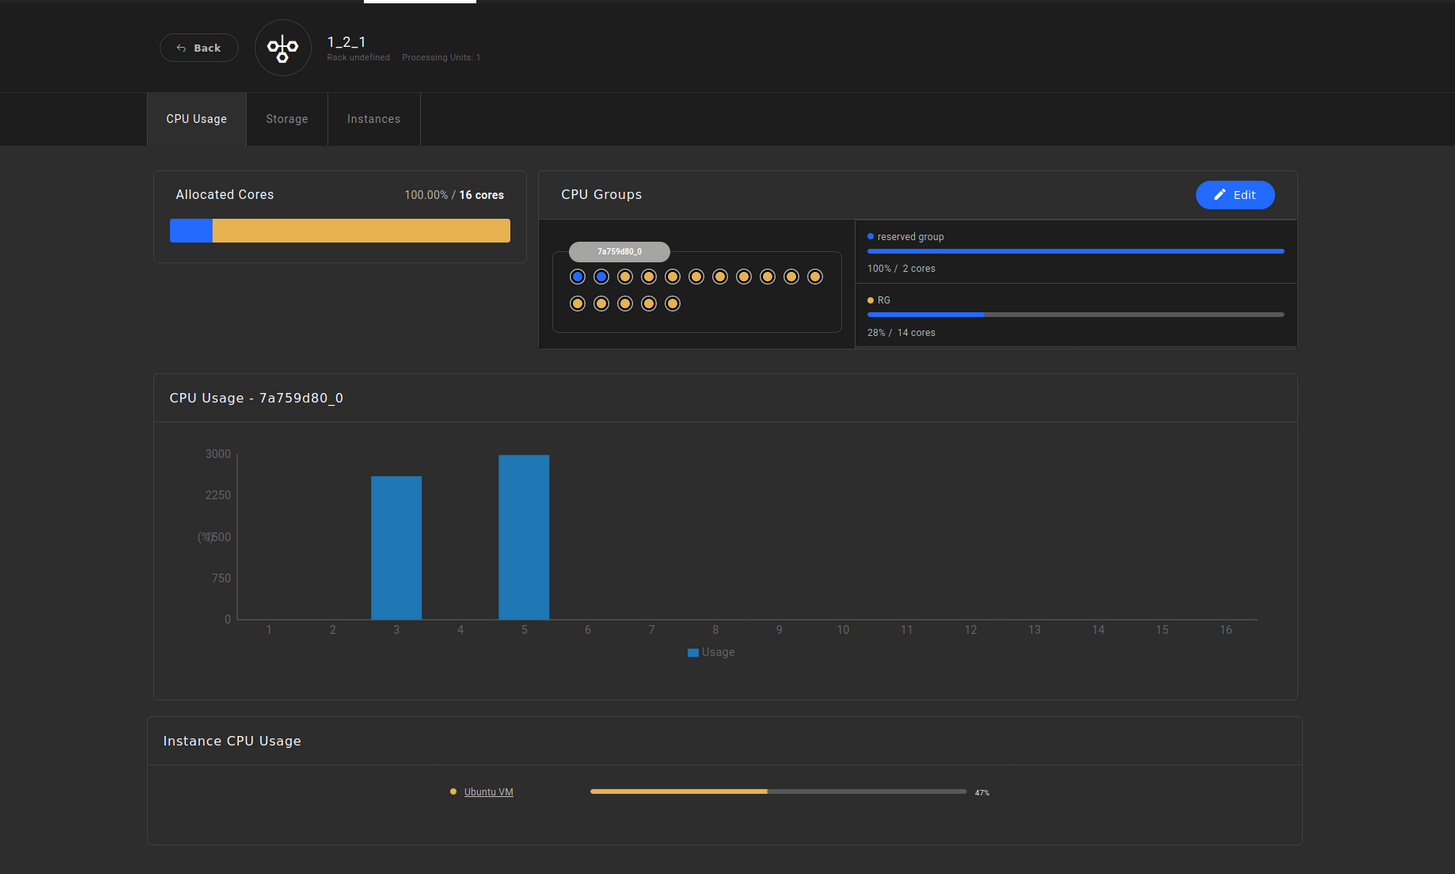
The user is able to review the resources of each node (CPU Usage , Storage and Instances), by clicking on the hexagon-shaped button corresponding to each node, as illustrated in the following image:
Additional Navigation
Notifications
Select the Notifications menu in the upper right corner of your Dashboard, where the list of Failure, Warning, and Success actions is displayed, including a detailed description for each action.
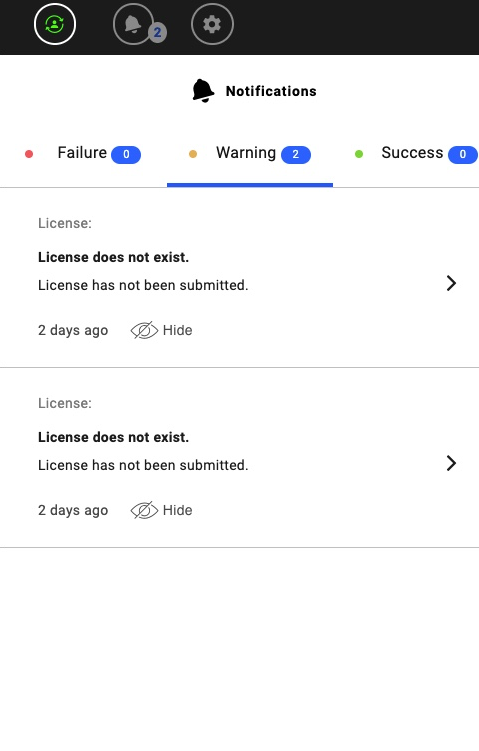
A notification alert informs the user about the expiration date of the license validity.
A limited access to the platform for 7 more days after the actual license expiration is provided. You will have to update your license, in order to avoid any disruption to your services.
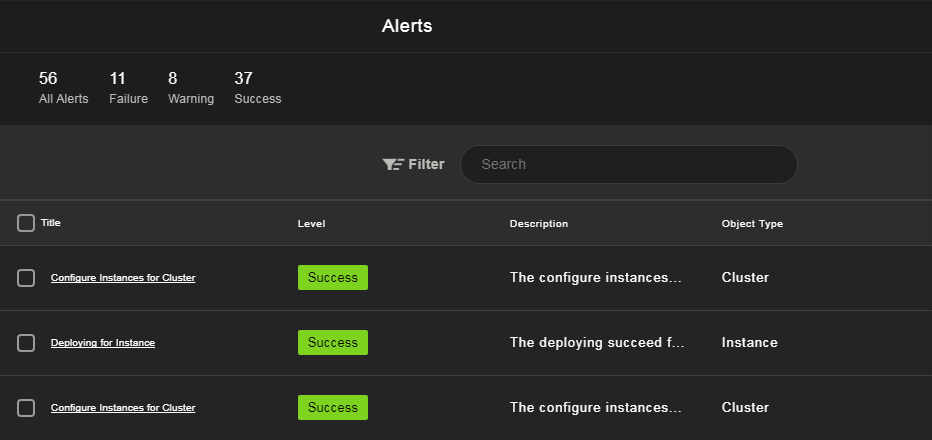
Select the '>' button next to the required notification to view the "Alerts" page, which displays the entire list of system alerts.
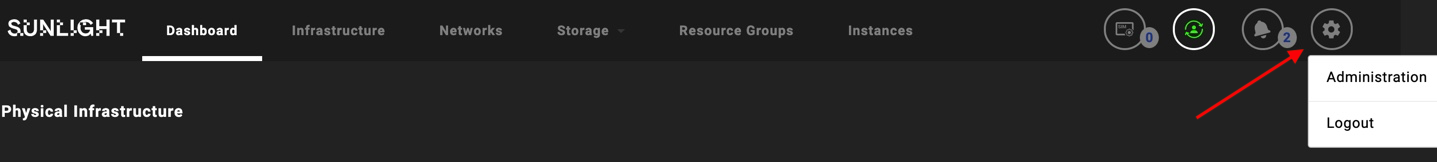
Account Settings
Click the Account Setting button in the upper right corner of the Dashboard and select one of the available options:
-
Select the Administrator option to manage the following platform settings:
-
Licenses tab displays the number of valid licenses in your system. Click on details to view the information on all available licenses.
-
Database Metadata tab displays the records of the metadata database. Click on details to acquire the backup of the desired metadata.
-
The Keypairs tab displays the list of keypairs available in the cloud. Click the Create Keypair button to view your Public key and Key alias.
-
User tab displays the number of users, including some additional details.
-
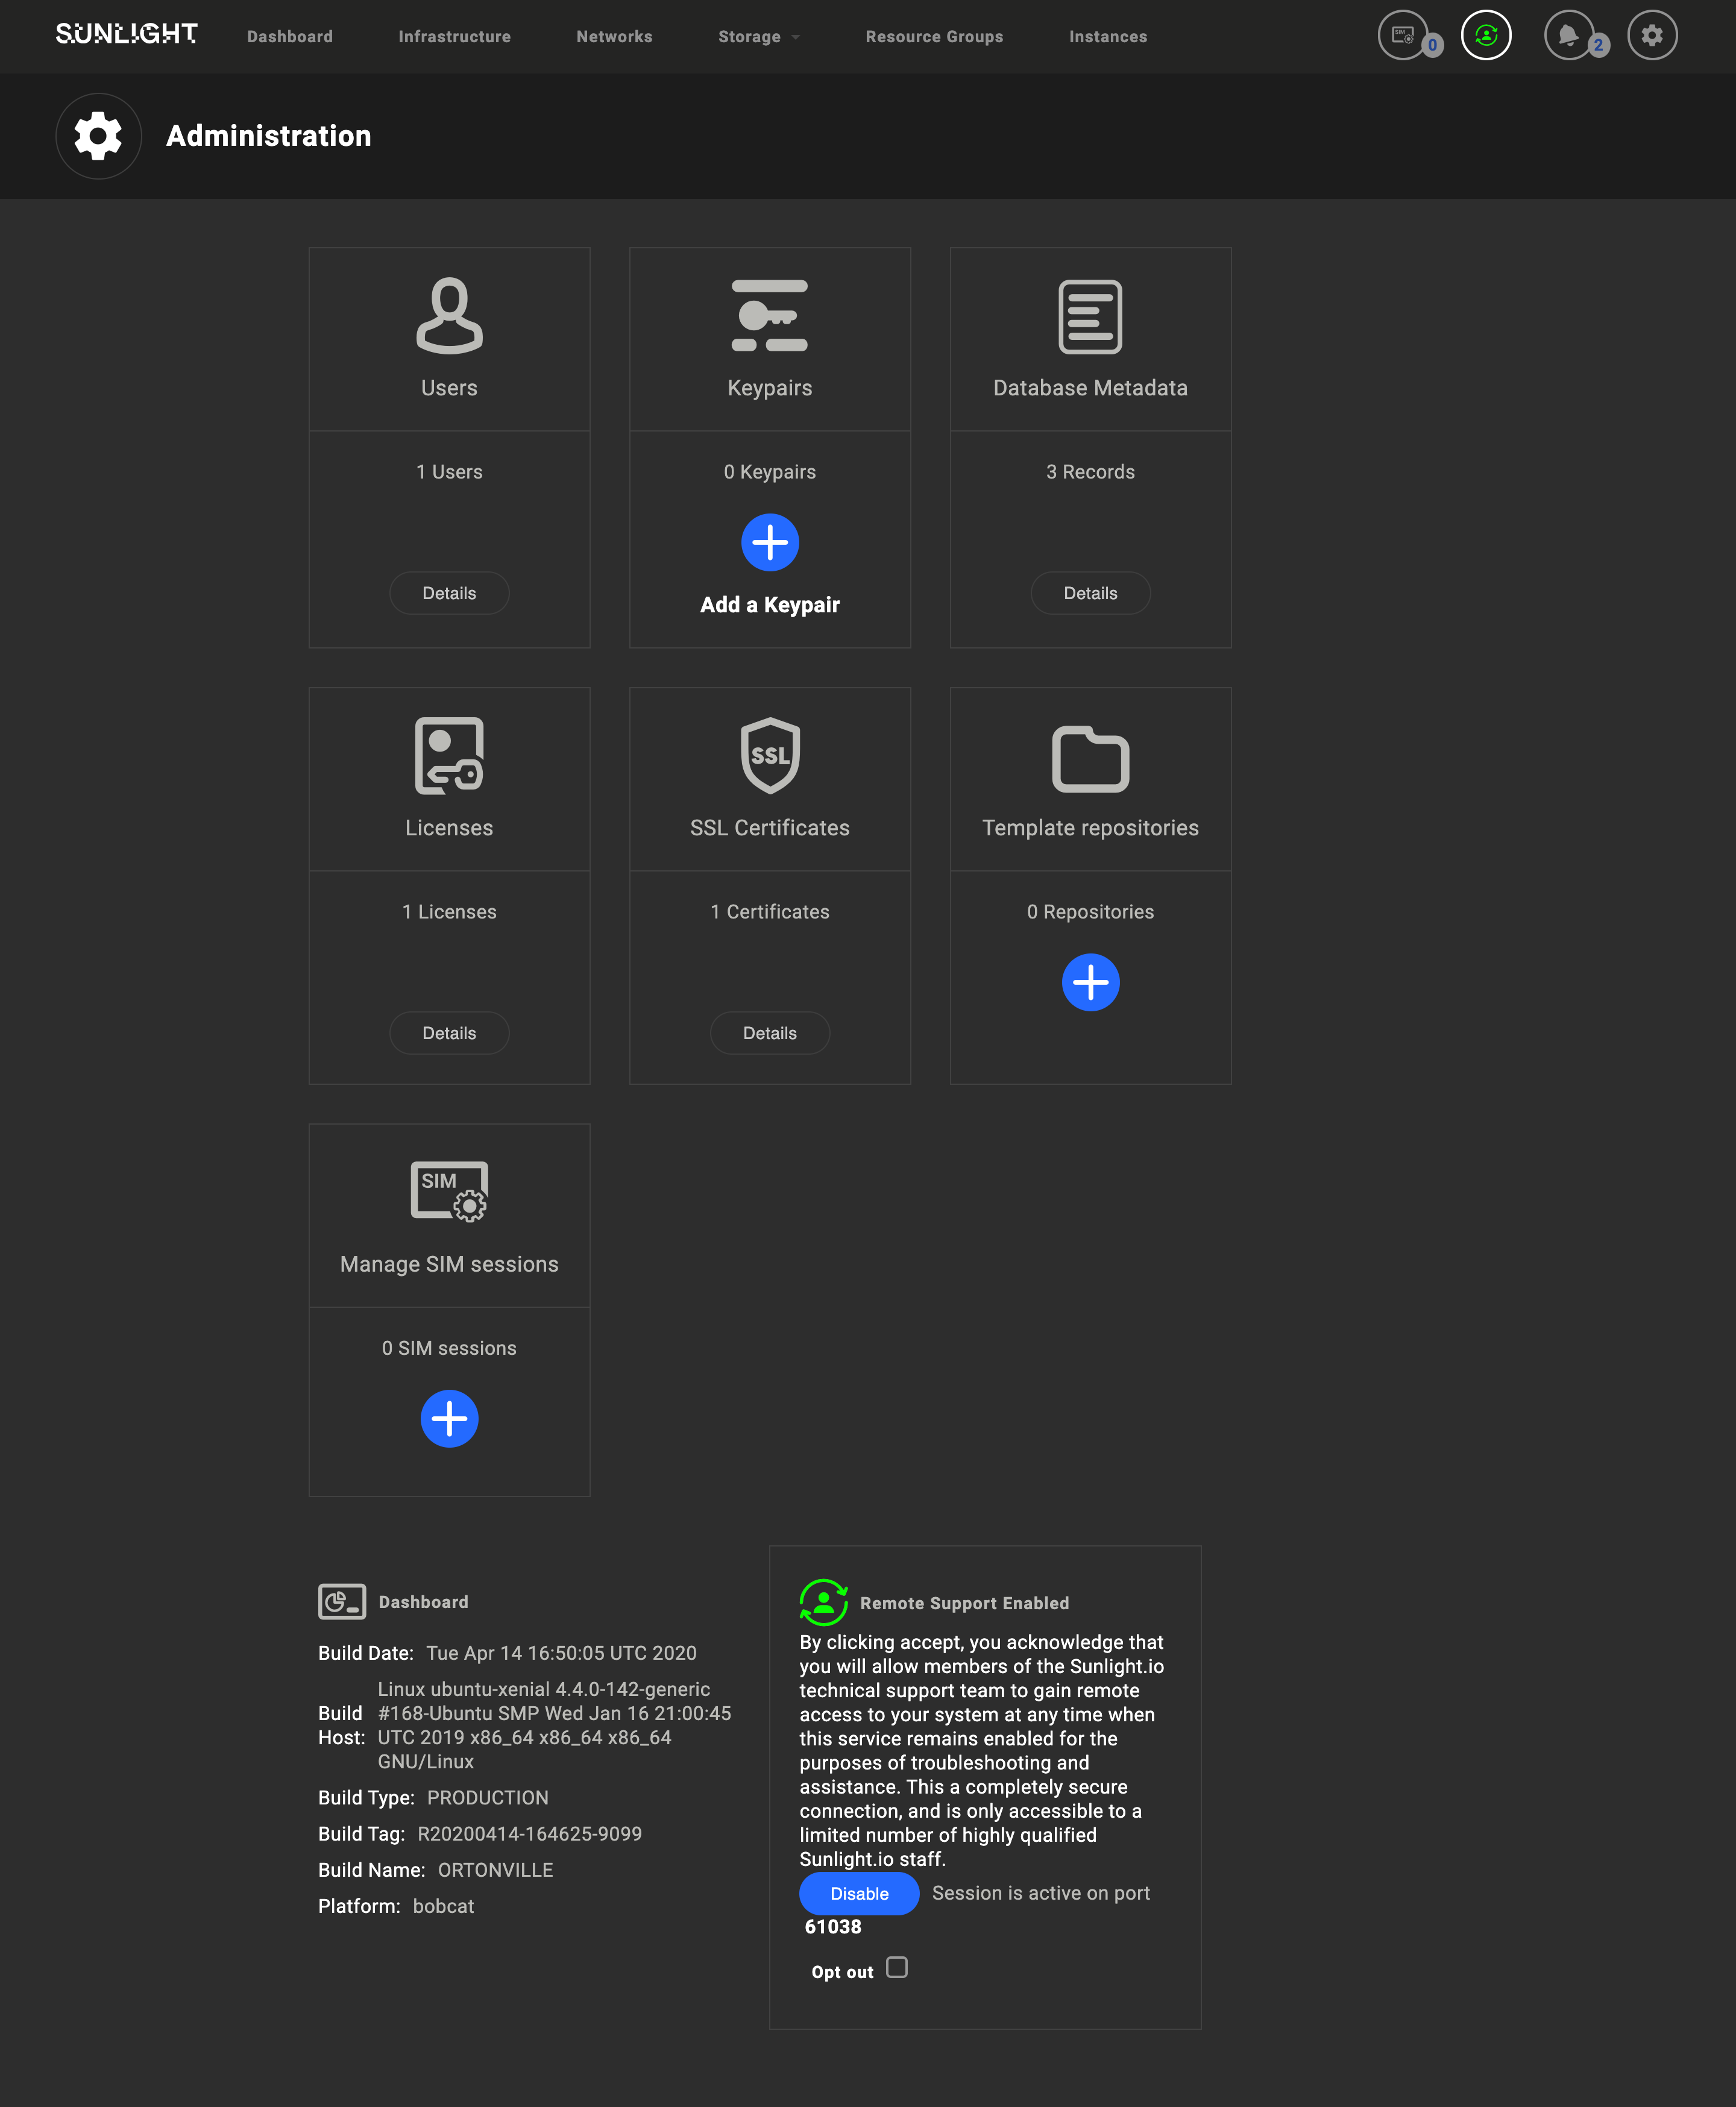
Dashboard version and API information are provided at the bottom left corner of the UI.
- Click the Logout button to log out from the Dashboard.